At Sprintly, we have a lot of data on developer cycle time. We track how long it takes them to complete different types of tasks (Stories, Tests, Bugs), as well as different sizes of tasks (S, M, L, XL).
The sample size was 147,494 items that had been both accepted & scored.
Patterns we seen at Sprintly
1. Developers are remarkably average. Our ticket data shows that across all of our users, cycle times are very similar:
75% of all tickets in our system are started and completed in about 175 hours.
1 ticket to close on ~ 175 hours or 21 work days or 1 elapsed work month!
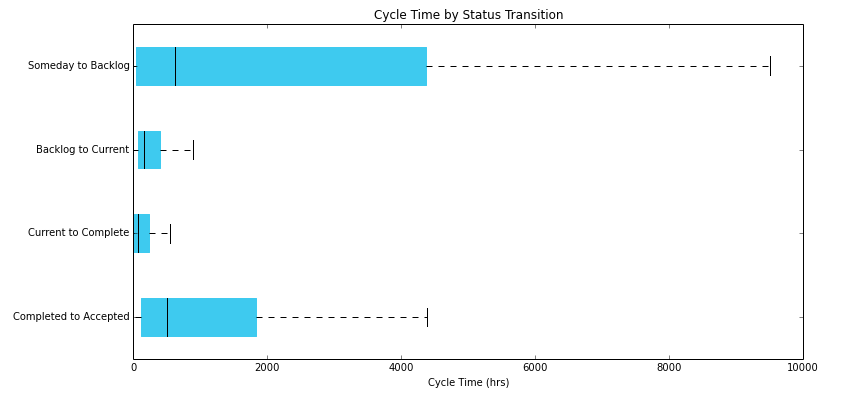
2. Most of the variability occurs before a ticket has been started (Someday to Backlog). This is the stage when stakeholders are figuring out specs and prioritizing work. In the Kanban world, this is typically called reaction time (the amount of time from when the ticket is created to when it is prioritized). There’s a lot of time wasted at this stage:
3. it also appears that teams have a hard time transitioning from “done” to “tested and ready to be deployed” (look at Completed to Accepted above).
Context switching introduces huge costs
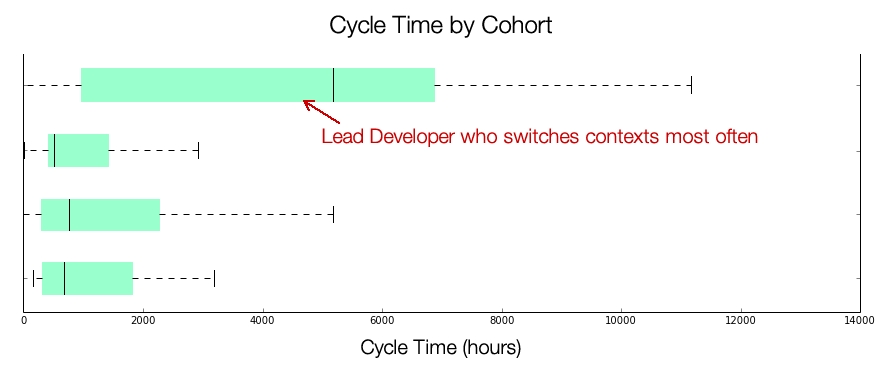
For example, we have a Lead Developer who does a lot of code reviews, pairing, going to meetings, and fighting fires.
Here’s a graph that shows cycle times for developers on our team:

In this case, it’s the nature of the Lead Developer’s role that affects the amount of time it takes him to complete tasks.
The problem arises when you, as a manager, switch your developers to new tasks mid-stream. If your priorities are always shifting, you’re introducing
huge costs to your team.


